

AACo- Natural Capital Vegetation Assessment - Gulf Group.
Australian Agricultural Company (AACo).
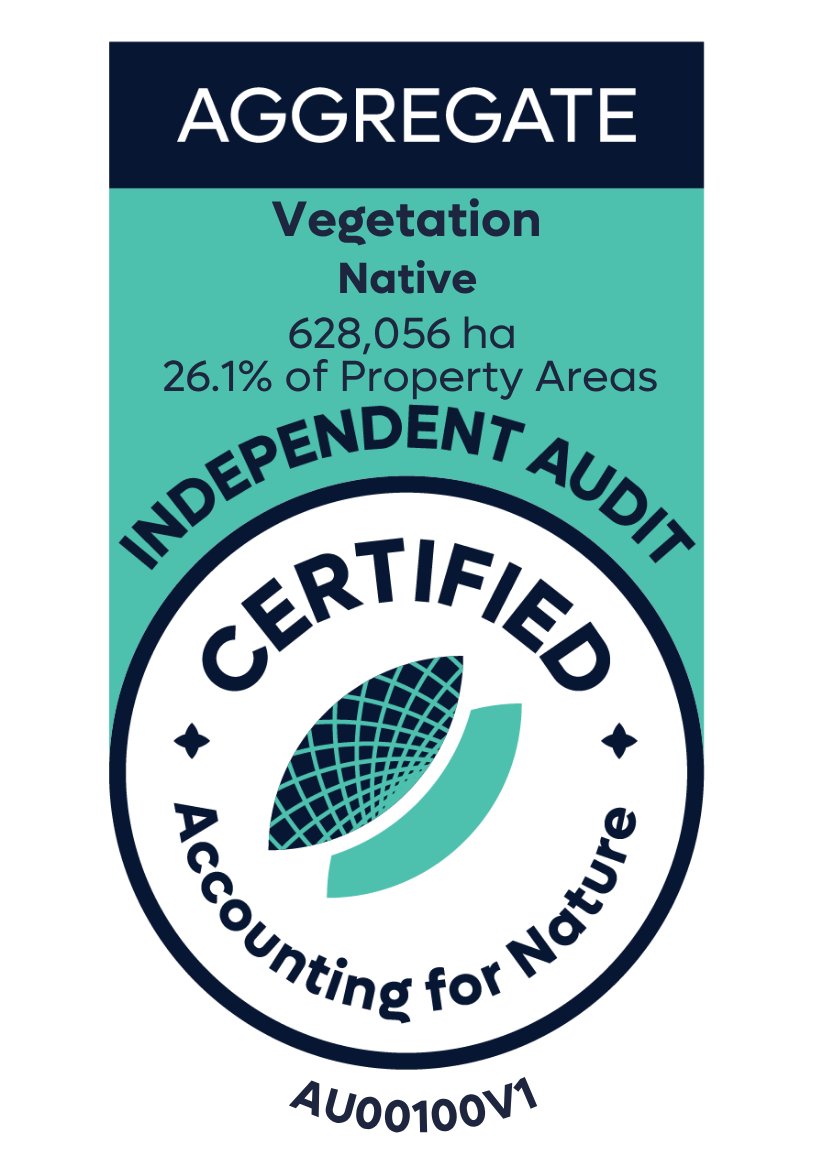
Vegetation Asset Account.
Environmental Account ID: AU00100
Account Holder: Australian Agricultural Company (AACo)
Purpose: Document the condition of the native vegetation, to inform sustainable management of the 6 properties, and to communicate environmental outcomes for internal and external purposes.
Current land use: Grazing/Cropping
Environmental Asset: Vegetation - Native
Asset Account ID: AU00100V1
Registration Date: 09 April 2025
Certification date: 18 May 2026
Certification pathway: Independent Audit (reasonable assurance)
Asset Accountarea: 628,056 ha (26.1% of total aggregate property area)
Scale: Aggregate
Method: AfN-METHOD-V-10
Asset Account snapshot.

Asset Account Econd® summary.
Asset Account statement.
-
09 April 2025 - Registration Date
-
18 May 2026 - Certification Date
Significant outcomes.
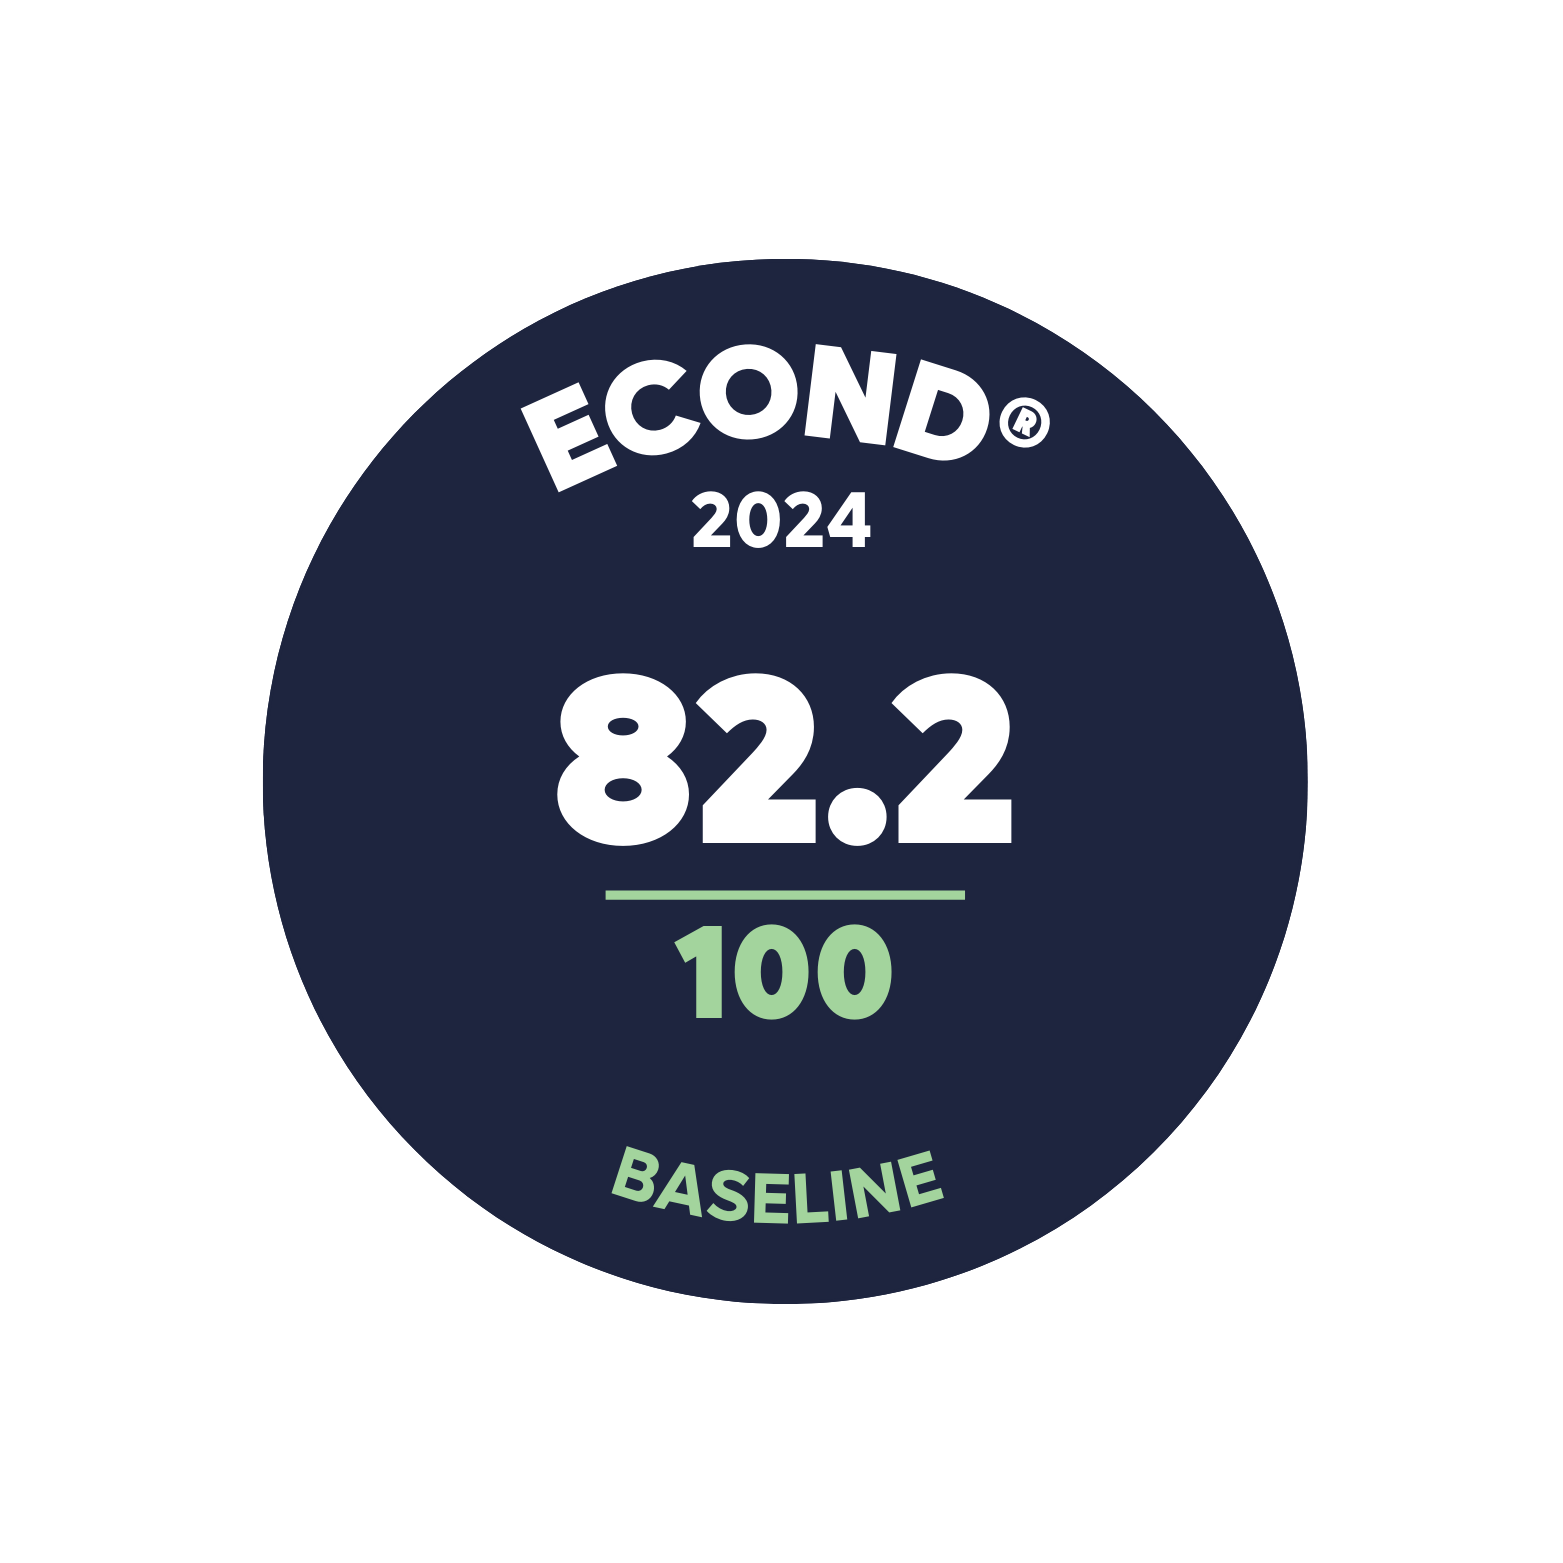
The Queensland Herbarium’s regional ecosystem (RE) mapping identifies both remnant and non-remnant ecosystems of conservation significance. These ecosystems differ in their extent and ecological integrity, with several listed as endangered under the EPBC Act. On these properties, only the highest-priority landscape, classified as Tier 1, was surveyed and in 2 properties Tier 2 and Tier 3, which primarily consisted of remnant vegetation and associated Threatened Ecological Communities (TECs). These results emphasize the importance of protecting and maintaining the remaining remnants of these vulnerable ecosystems. Among the surveyed assessment units, Gidgee woodland (sparse or spinifex ground layer) recorded the lowest Econd® score at 73.2, while the Medium palatable grasslands/shrublands highest-scoring assessment unit reached 91.5. The overall asset Econd® was found to be 82.2.
Limitations & disclosures.
Limitations In tree and shrub model.
While the model used to segment the crowns of woody plants was generally effective, there were some environments where it was unable to effectively capture these plants, and low shrubs were not adequately detected. These include some of the river systems and water courses and Alluvial Plains/Creekline Woodlands/Herblands sub-assets. This limitation may have led to under-estimation of total canopy and shrub cover scores at some sites.
High litter cover values leading to lower scores
The surveys took place during an uncharacteristically wet period, and as a result, ground cover values including litter cover were often considerably higher than benchmark values. As such, the resultant lower indicator condition scores may not necessarily reflect poor condition.
Insufficient area of target vegetation class covered.
Of the 156 drone plots analysed, 29 had a total target vegetation class of below the required 5-hectares (When rounded to 2 decimal places; Table 11). For the majority of these sites, this result was caused by small parts of the flight area being excluded due to being mapped as a different vegetation type – with only 5 sites covering less than 4.5-hectares. Nevertheless, the assessment of these smaller areas is expected to produce reasonable assessment of the drone-derived indicators, and results from these sites were not removed from the final analysis.
The K and L indicators were merged to match the approach taken by BioCondition
The BioCondition benchmarks did not separate between indicator K (Native species count for herbaceous species – forbs), and indicator L (Native species count for herbaceous species – other species). In order to make the observations of these indicators comparable with the BioCondition benchmarks, the forbs and other species were merged for the calculation of indicator condition scores. The original information of these two indicators has been preserved, so future assessments could separate them if more detailed benchmarks were made available.
Indicator J to match the approach taken by BioCondition vs expert elicitation reference
For Indicator J, both graminoids and grasses have been combined. However, according to the BioCondition reference data, only grasses should be included under Indicator J, while graminoids are intended to be accounted for under Indicators K and L.
Calculation of native tree species recruitment
While the Method recommends the use of a formula comparing the benchmark cover for recruitment to the observation, this approach was not deemed appropriate – as the translation of drone derived data did not accurately relate to the field derived benchmarks. As a result, recruitment was calculated as follows: when canopy trees were present, the presence of recruits within field data earned a score of 100, and the absence of recruits led to a score of zero. As more relevant benchmarks are made available, the incorporation of more sensitive recruitment measures will be considered.
Cryptogam was excluded from the account
Because cryptogam was not available as a benchmark for the chosen reference condition approach (published QLD BioCondition benchmarks), this indicator was excluded from this account. As with the merging of indicators K and L, the observations of cryptogam have been preserved and could be calculated later if benchmarks for this indicator were made available.
Native tree size structure was excluded from the account
The BioCondition benchmark for native tree size structure is provided as the number of large trees (separated into eucalypt and non-eucalypt) per unit area. The accurate measurement of tree size relative to these criteria was not feasible using drone data. As more detailed benchmarks and individual tree segmentation/classification approaches are made available, this indicator can be revisited for follow-up accounts.
Coarse woody debris calculation
An automatic approach to calculating the length of coarse woody debris was not feasible. As an alternative, this indicator was calculated by digitising (using a line draw tool in Drone-Deploy) all of the visible coarse woody debris within 0.1-hectare sub-plots for each of the sites. The length of each of the lines was then summed, and multiplied by 10, to provide an estimate of the length of coarse woody debris per hectare.
Insufficient Site Sampling
Medium palatable grasslands/shrublands, mixed‑species woodland/forest, and palatable tussock grasslands (high significance): Sampling intensity was not fully achieved due to remapping of certain areas, which led to changes in sample allocation across sub‑asset or assessment unit classes. This gap will be addressed in the next survey round. Two additional classes comprised less than 1% of the total area and, in line with the Method, were not required to be sampled.
Last update: 19 May 2026


Environmental Account.
Learn more about the Environmental Account.