

AACo - Natural Capital Vegetation Assessment - Central Queensland.
Australian Agricultural Company (AACo).
Vegetation Asset Account.
Environmental Account ID: AU00098
Account Holder: Australian Agricultural Company (AACo)
Purpose: Document the condition of the native vegetation, to inform sustainable management of the property, and to communicate environmental outcomes for internal and external purposes
Current land use: Grazing/Cropping
Environmental Asset: Vegetation - Native
Asset Account ID: AU00098V1
Registration date: 14 April 2025
Baseline Certification date: 18 May 2026
Certification pathway: Independent Audit (reasonable assurance)
Asset Account area: 6,075 ha (10% of total aggregate property area)
Method: AfN-METHOD-V-10
Asset Account snapshot.


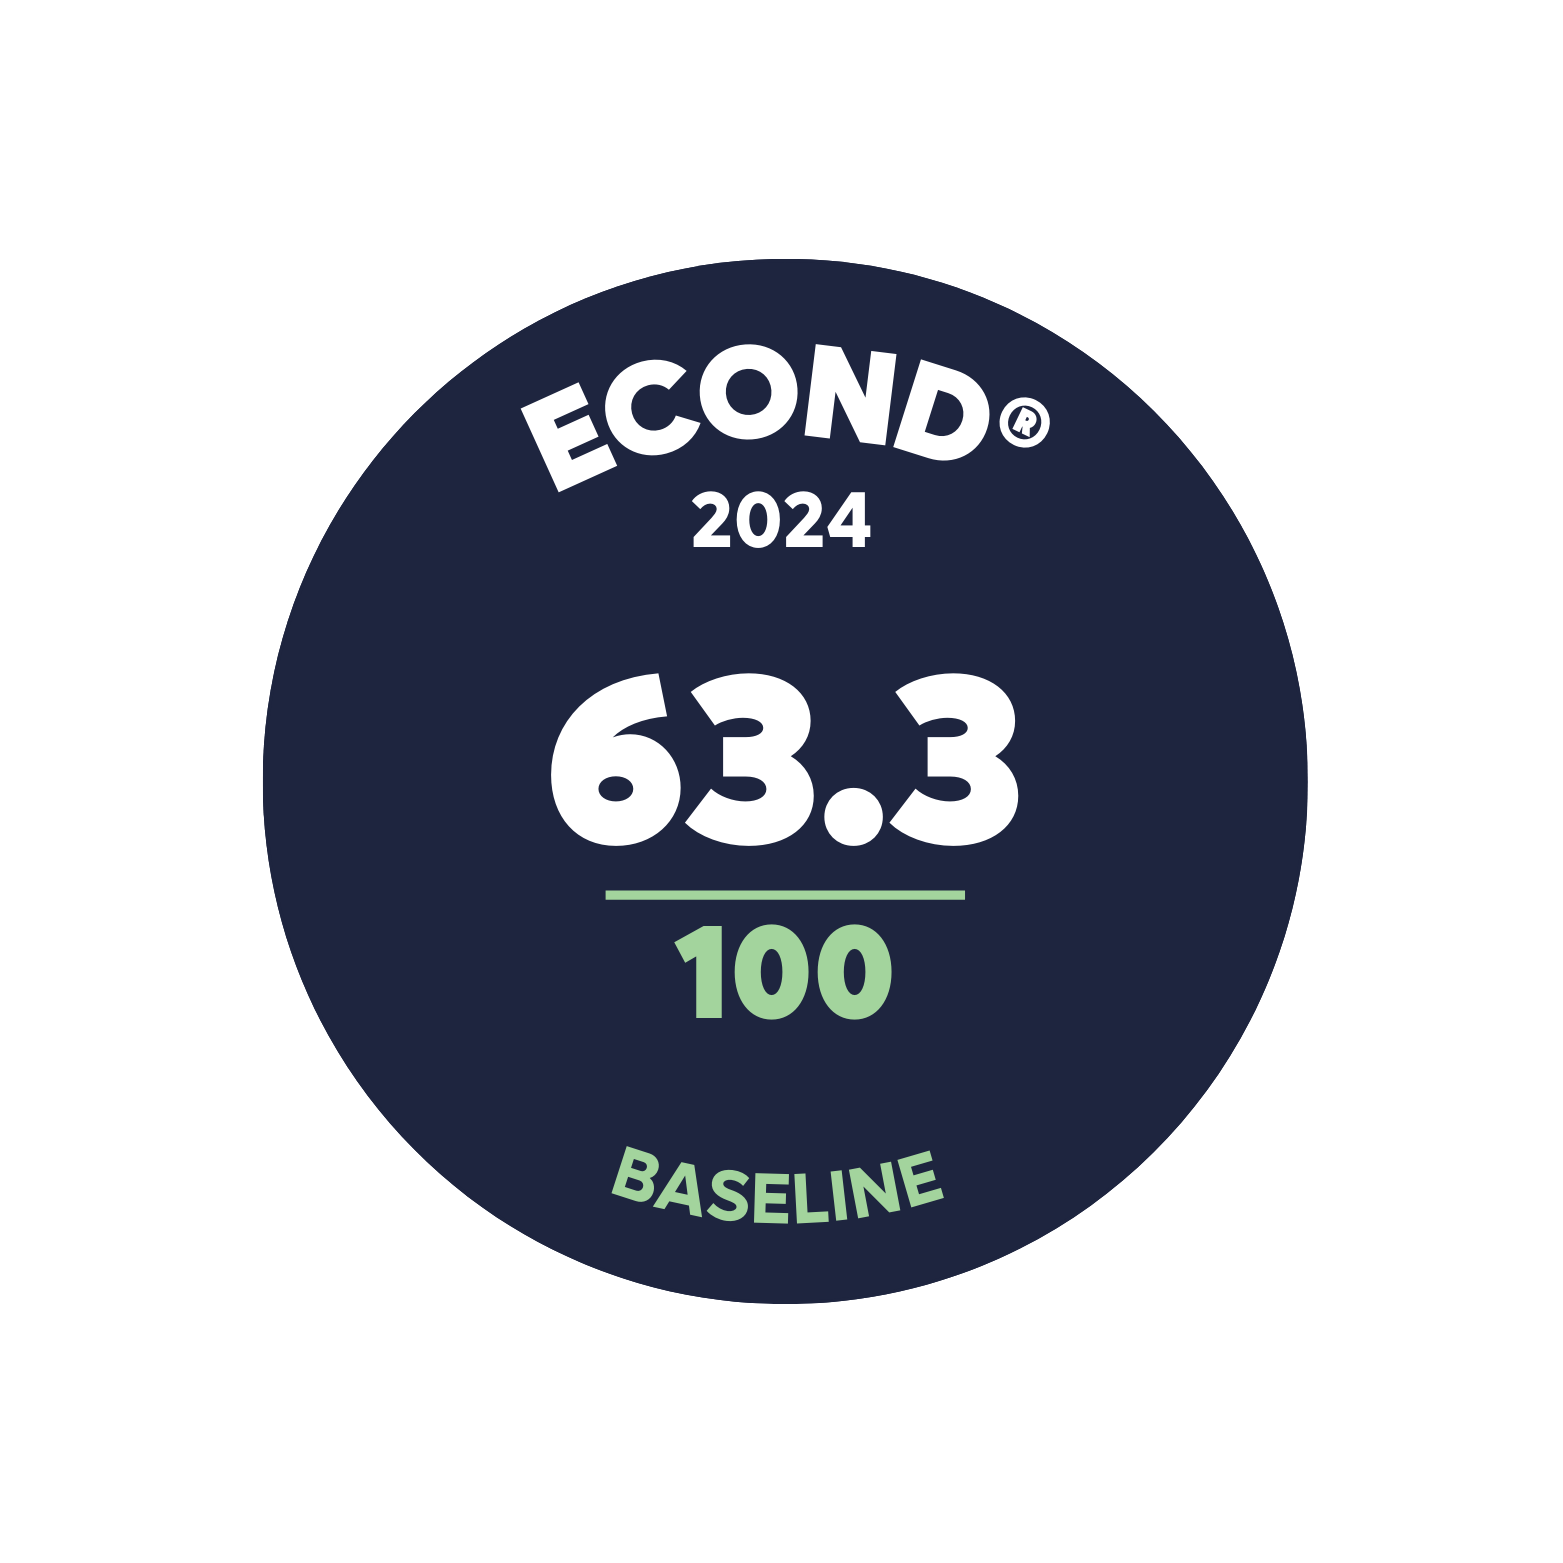
Asset Account Econd® summary.
Asset Account statement.
-
14 April 2025 - Registration Date
-
18 May 2026 - Certification Date
Significant outcomes.
The Queensland Herbarium’s regional ecosystem (RE) mapping identifies both remnant and non-remnant ecosystems of conservation significance. These ecosystems differ in their extent and ecological integrity, with several listed as endangered under the EPBC Act. On this property, only the highest-priority landscape, classified as Tier 1, was surveyed, which primarily consisted of remnant vegetation and associated Threatened Ecological Communities (TECs). The findings highlight limitations in vegetation mapping, including those from other States and Territories, particularly when it comes to accurately representing threatened communities. These results emphasize the importance of protecting and maintaining the remaining remnants of these vulnerable ecosystems. Among the surveyed assessment units, the Palatable Tussock Grasslands TEC (high significance) recorded the lowest Econd® score at 51.6, while the highest-scoring assessment unit, Brigalow woodland/open forest-TEC, scored an Econd® 73.7.
Limitations & disclosures.
Insufficient area of target vegetation class covered.
Of the 34 drone plots analysed, 6 had a total target vegetation class of below the required 5-hectares (Table 10). This was the result of erroneous flight planning, where the Incorrect vegetation was measured. Nevertheless, the assessment of these slightly smaller areas is expected to produce reasonable results, and results from these sites were not removed from the final analysis.
Sites not analysed in the remote sensing workflow
Two sites, GLEN002 and WYRA004, were not analysed as part of the remote sensing analysis. As a result, a manual annotation approach was taken to calculate the proportion of cover of the relevant classes for these sites. For this, a 0.1-hectare sub-plot was generated at the centre of the orthomosaic in the cloud-based DroneDeploy platform. Then, the cover of trees, shrubs, bare ground and ground cover was digitised. The area of these classes was calculated and used to derive indicator values.
The K and L indicators were merged to match the approach taken by BioCondition
The BioCondition benchmarks did not separate between indicator K (Native species count for herbaceous species – forbs), and indicator L (Native species count for herbaceous species – other species). In order to make the observations of these indicators comparable with the BioCondition benchmarks, the forbs and other species were merged for the calculation of indicator condition scores. The original information of these two indicators has been preserved, so future assessments could separate them if more detailed benchmarks were made available.
Indicator J to match the approach taken by BioCondition vs expert elicitation reference
According to the BioCondition reference data, only grasses should be included under Indicator J, while graminoids are accounted for under Indicators K and L.
Calculation of native tree species recruitment
While the Method recommends the use of a formula comparing the benchmark for recruitment to the observation, this approach was not deemed appropriate – as the translation of drone derived data did not accurately relate to the field derived benchmarks. As a result, recruitment was calculated as follows: when canopy trees were present, the presence of recruits within field data earned a score of 100, and the absence of recruits led to a score of zero. As more relevant benchmarks are made available, the incorporation of more sensitive recruitment measures will be considered.
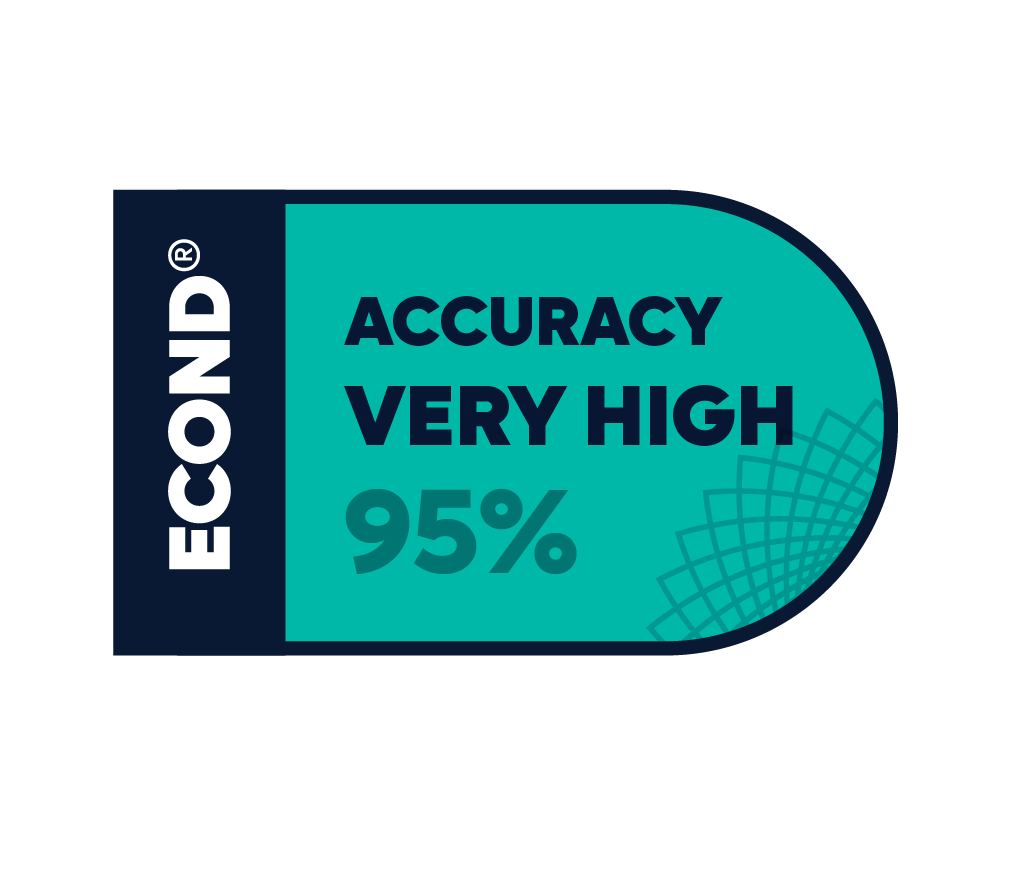
Accuracy assessment sampling intensity
Within the Central Queensland Asset Account, the total number of validation points for the remote sensing accuracy assessment was 306, lower than the 683 suggested by the Method. However, this lower number is the result of the lower number of individual sites, not a reduction in sampling intensity on a per site basis – and as such, is not expected to have a material impact on the reliability of the accuracy assessment. Additionally, alternative approaches to the accuracy assessment have been suggested by remote sensing scientists from Astron (now Ecocene) - who managed the geobia classification (see Supplementary Document 1). These suggestions will be considered for future iterations of the Method.
Cryptogam was excluded from the account
Because cryptogam was not available as a benchmark for the chosen reference condition approach (published QLD BioCondition benchmarks), this indicator was excluded from this account. As with the merging of indicators K and L, the observations of cryptogam have been preserved and could be calculated later if benchmarks for this indicator were made available.
Native tree size structure was excluded from the account
The BioCondition benchmark for native tree size structure is provided as the number of large trees (separated into eucalypt and non-eucalypt) per unit area. The accurate measurement of tree size relative to these criteria was not feasible. As more detailed benchmarks and individual tree segmentation / classification approaches are made available, this indicator can be revisited for follow-up accounts.
Coarse woody debris calculation
An automatic approach to calculating the length of coarse woody debris was not feasible. As an alternative, this indicator was calculated by digitising (using a line draw tool in Drone-Deploy) all of the visible coarse woody debris within 0.1-hectare sub-plots for each of the sites. The length of each of the lines was then summed, and multiplied by 10, to provide an estimate of the length of coarse woody debris per hectare.
Insufficient Sampling Intensity
The three Assessment Units in the Central Queensland Environmental Account that did not meet the minimum sampling requirements.
Expectation of Brigalow Presence
At the outset of planning, we anticipated a higher presence of Brigalow ecosystems than was ultimately observed in the field. This influenced the initial allocation of plots and contributed to the shortfall in sampling for certain units.
Differences Between ‘Of Concern’ and ‘No Concern’ Areas
The ‘No Concern’ areas within these Assessment Units are small compared to the ‘Of Concern’ areas. As a result, greater emphasis was placed on sampling Threatened Ecological Communities (TECs) and ‘Of Concern’ areas to ensure adequate representation of higher‑value ecosystems.
Coverage of Sub‑assets vs. Assessment Units
While the sub‑assets themselves were sampled, some individual Assessment Units within those sub‑assets did not reach the minimum number of plots. We plan to address this gap in the next survey round to ensure full compliance with the Method.
Environmental markets.

Australian Carbon Credit Unit (ACCU) Scheme project, registered with the Australian Clean Energy Regulator. More information can be found here:
Last update: 19 January 2026


Environmental Account.
Learn more about the Environmental Account.