

AACo – Natural Capital Vegetation Assessment - Barkly Group.
Australian Agricultural Company (AACo).
Vegetation Asset Account.
Environmental Account ID: AU00097
Account Holder: Australian Agricultural Company (AACo)
Purpose: To document the condition of native vegetation to inform sustainable management across the properties and communicate environmental outcomes internally and externally
Current land use: Grazing
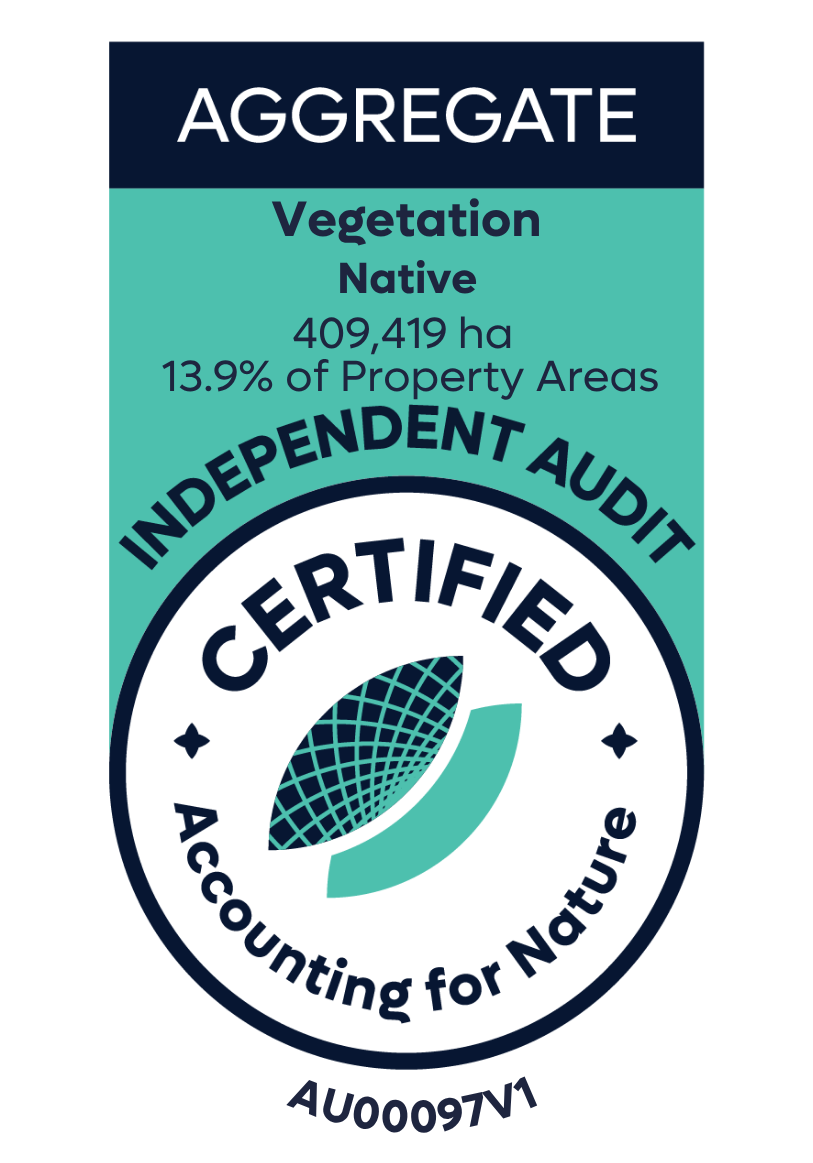
Environmental Asset: Vegetation - Native
Asset Account ID: AU00097V1
Registration date: 02 April 2025
Baseline Certification date: 18 May 2026
Certification pathway: Independent Audit (reasonable assurance)
Asset Account area: 409,419 ha (13.9% of total aggregate property area)
Method: AfN-METHOD-V-10
Asset Account snapshot.

Asset Account Econd® summary.
Asset Account statement.
-
02 April 2025 - Registration Date
-
18 May 2026 - Certification Date
Significant outcomes.
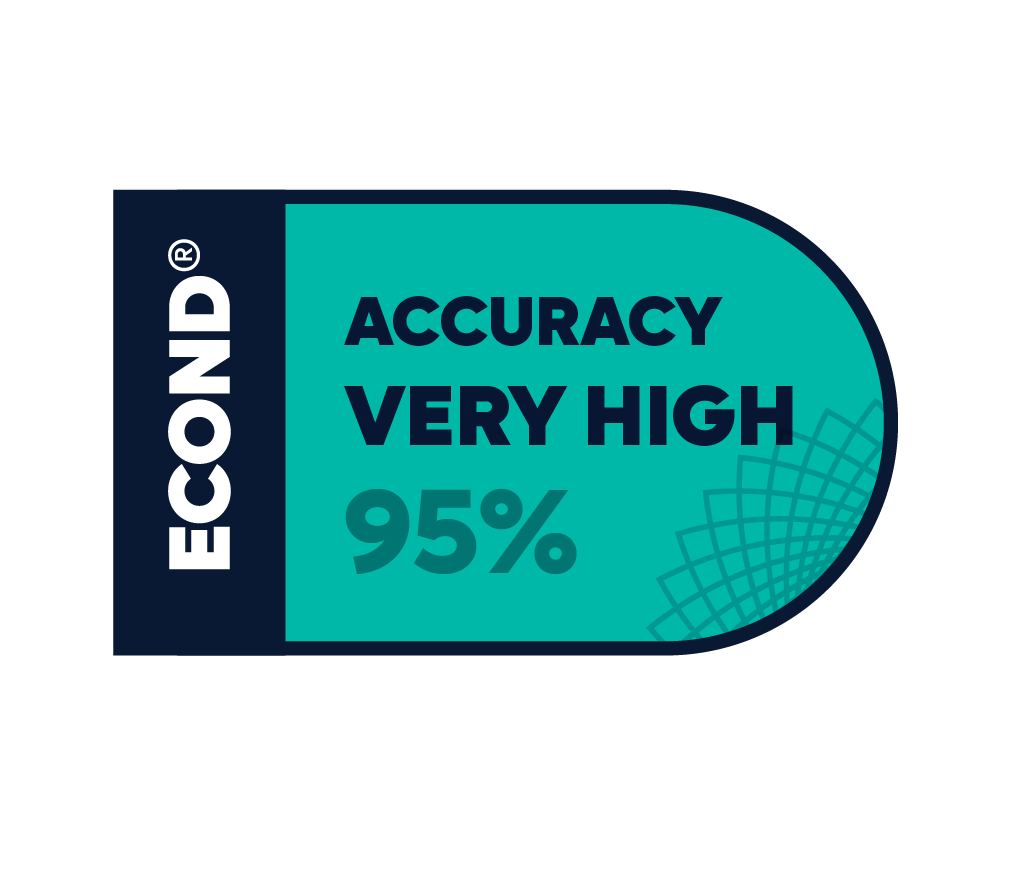
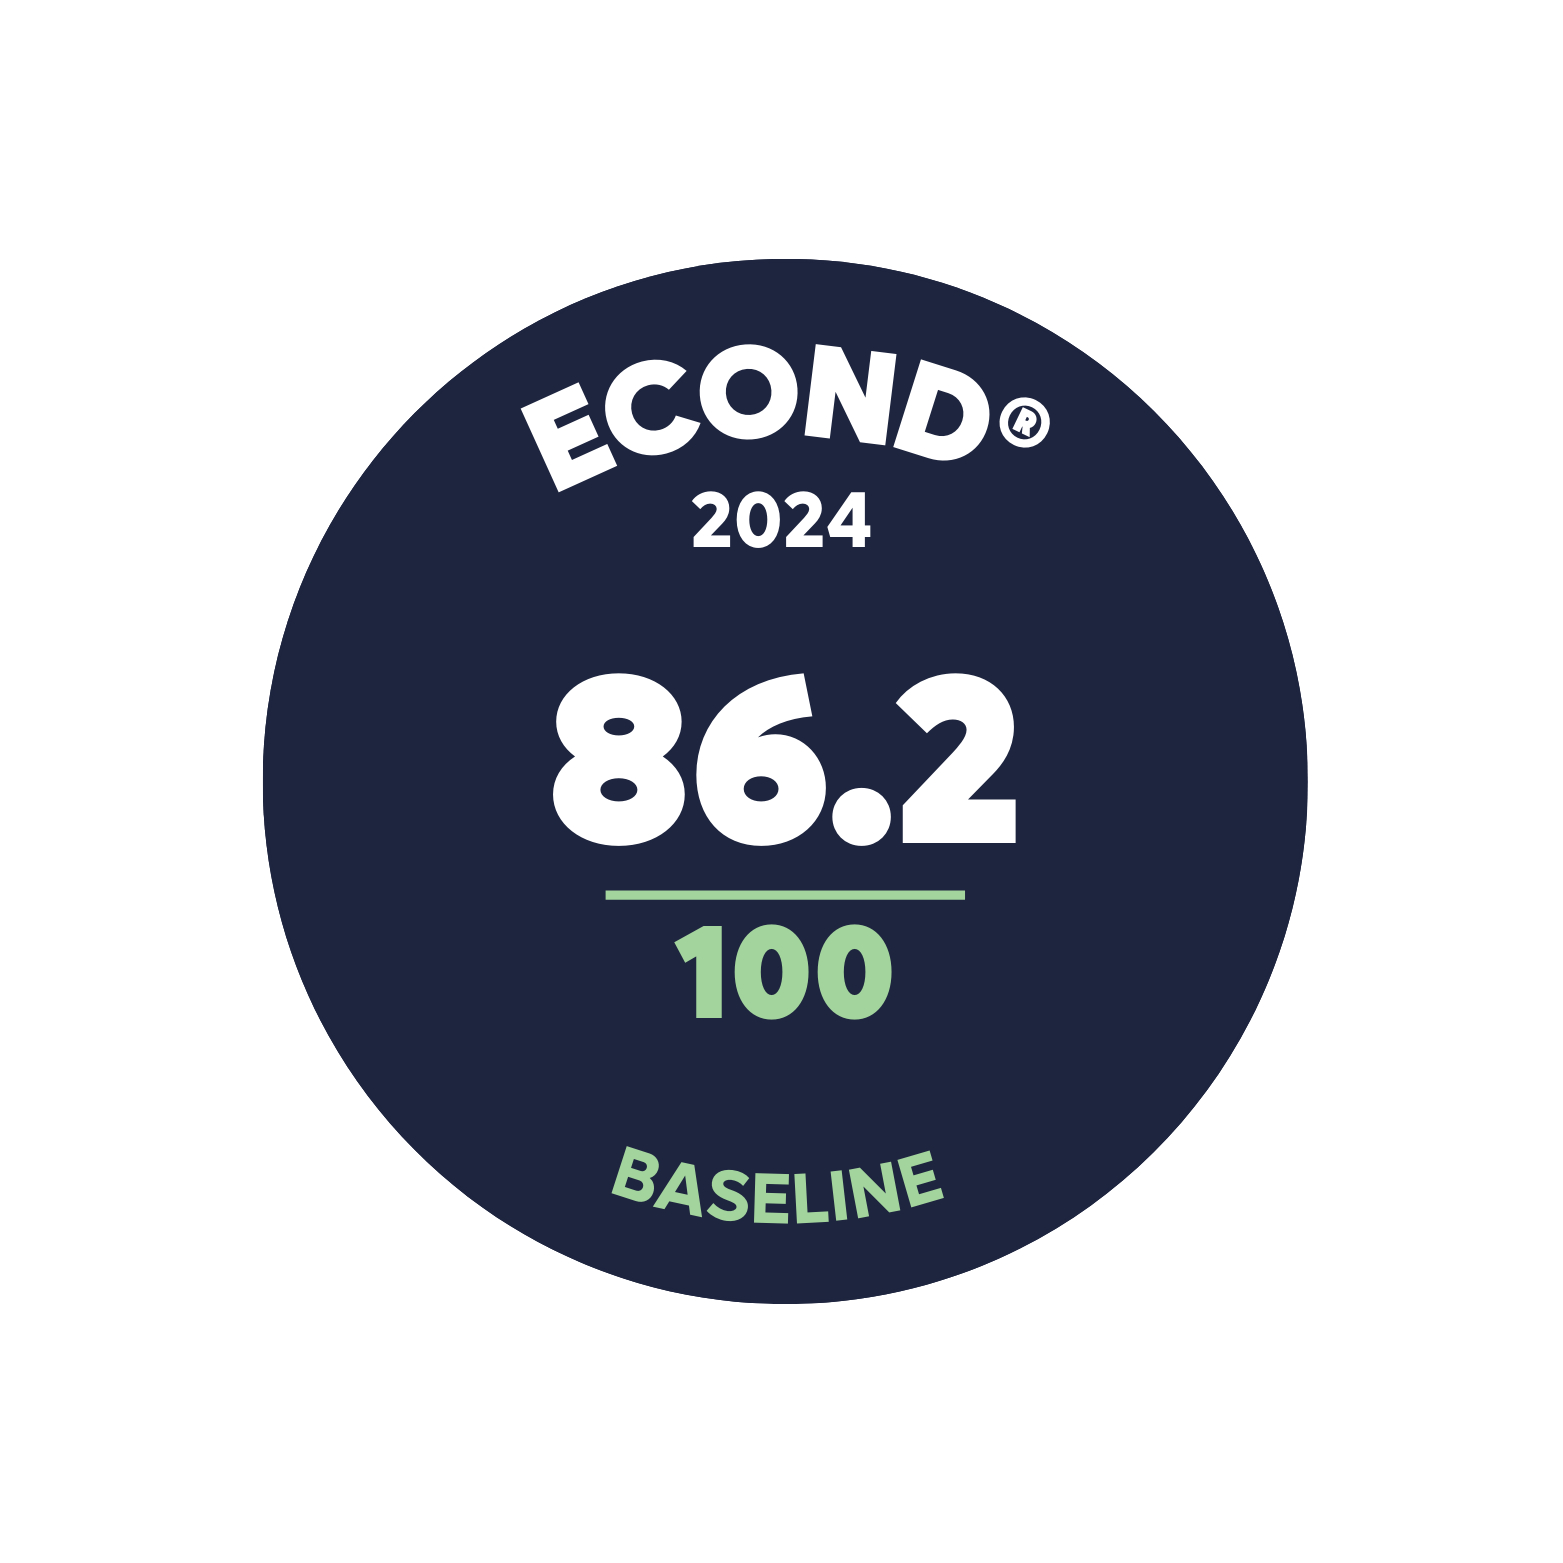
Vegetation across the Barkly Group properties (over 2.9 million hectares of semi-arid grasslands) was stratified and assessed, identifying 409,419 ha of Tier 1 Broad Vegetation Types (BVTs) representing the highest conservation value. These Tier 1 BVTs, validated through field-based classification with 92% accuracy, form the basis of the sub-asset account and highlight the region’s ecological significance. The properties and sub-assets were found to be in similar environmental condition. The overall Asset Econd® was found to be 86.2. The Seasonal Wetlands/Lakes sub-asset was found to have the highest Econd® score of 88.7, while the Alluvial plains/Creekline woodlands/herblands sub-asset had the lowest Econd® score of 79.5. This demonstrates AACo’s management focus on balancing large-scale cattle grazing with sustainable land management practices.
Limitations & disclosures.
Insufficient area of target vegetation class covered.
Of the 65 drone plots analysed, one had a total target vegetation class of below the required 5-hectares, with EVAD010 covering 4.6 hectares of target vegetation.
Sites not analysed in the remote sensing workflow
Two sites, AVOD005 and AVOD008, were not analysed as part of the remote sensing analysis. As a result, a manual annotation approach was taken to calculate the proportion of cover of the relevant classes for these sites. For this, a 0.1-hectare sub-plot was generated at the centre of each orthomosaic in the cloud-based DroneDeploy platform. Then, the cover of trees, shrubs, bare ground and ground cover was digitised. The area of these classes was calculated and used in subsequent analysis to derive indicator values.
The K and L indicators were merged to match the approach taken by BioCondition
The format of the Queensland BioCondition benchmarks was followed for this account. This format does not separate between indicator K (Native species count for herbaceous species – forbs), and indicator L (Native species count for herbaceous species – other species). In order to make the observations of these indicators comparable with the format of the BioCondition benchmarks, the forbs and other species were merged for the calculation of indicator condition scores. The original information of these two indicators has been preserved, so future assessments could separate them if more detailed benchmarks were made available.
Accuracy assessment sampling intensity
Within the Barkly Asset Account, the total number of validation points for the remote sensing accuracy assessment was 611, lower than the 683 suggested by the Method. A fixed intensity of 10 points per site was applied, which ensured a consistent approach regardless of the number of sites. Alternative approaches to accuracy assessment have been suggested by remote sensing scientists from Astron (now Ecocene) - who managed the geobia classification (see Supplementary Document 1). These suggestions will be considered for future iterations of the Method.
Cryptogam was excluded from the account
Because benchmark data for cryptogam cover was not available, including within the BioCondition datasets, this indicator was excluded from this account. As with the merging of indicators K and L, the observations of cryptogam have been preserved and could be calculated later if benchmarks for this indicator were made available.
Native tree size structure was excluded from the account
The BioCondition benchmark for native tree size structure is provided as the number of large trees (separated into eucalypt and non-eucalypt) per unit area. The accurate measurement of tree size relative to these criteria was not feasible. As more detailed benchmarks and individual tree segmentation/classification approaches are made available, this indicator can be revisited for follow-up accounts.
Coarse woody debris calculation
An automatic approach to calculating the length of coarse woody debris was not feasible. As an alternative, this indicator was calculated by digitising (using a line draw tool in Drone-Deploy) all of the visible coarse woody debris within 0.1-hectare sub-plots for each of the sites. The length of each of the lines was then summed, and multiplied by 10, to provide an estimate of the length of coarse woody debris per hectare.
Calculation of native tree species recruitment
While the Method recommends the use of a formula comparing the benchmark cover for recruitment to the observation, this approach was not deemed appropriate – as the translation of drone derived data did not accurately relate to the field derived benchmarks. As a result, recruitment was calculated as follows: when canopy trees were present, the presence of recruits within field data earned a score of 100, and the absence of recruits led to a score of zero. As more relevant benchmarks are made available, the incorporation of more sensitive recruitment measures will be considered.
Last update: 18 May 2026


Environmental Account.
Learn more about the Environmental Account.